Monday, December 6, 2021

2021 College Football Bowl Prediction Pool

The college football conference championships were played this past weekend which means the 2021 NCAA college football bowl season is here again! Therefore, it’s time to make your picks and predictions about who you think will win each bowl game. One of the best times of the holiday season (other than giving and receiving gifts) is being able to talk trash to your relatives about their terrible bowl picks. This year has the added bonus of not just single bowl games but the eighth year of a four team playoff to determine the national champion.


Features for this year's bowl prediction pool over the previous college football bowl pool manager spreadsheets include the following:

  • Easy method to make each bowl game worth a different point value, so the national championship game and semi-finals can be worth more points, or however you want to customize it.

  • Updated leaderboard tab with new stats

  • Separate entry sheet to pass out to participants or co-workers that can be imported automatically by a built-in macro

  • Complete NCAA college football bowl schedule with game times and TV stations

  • New stat sheet to track each conference's record during bowl season. Graph shows total conference teams and total conference wins

bowl pick em excel sheet download


The bowl prediction sheets include the football helmet designs for every team (taken from the 2017 college football helmet schedule spreadsheet), their win-loss record, and the logo for all bowl games. I added the helmets so those players who aren't big college football fans can pick a winner based on their favorite helmet design!

Download the CFP Pool Manager and Single Entry Form here

I'm working on a new version where you could do confidence points that you can test out now and give me feedback.


Download the 2021 CFP Bowl Prediction Pool Manager.xlsm file here

Please let me know if you have any questions, comments, find any bugs, or have any suggestions for improvement. I love that people are using this Bowl Prediction Game to help raise money for charity, that's so awesome to hear! What team are you rooting for?


Thursday, November 18, 2021

Gift Guide for Excel Users 2021

 The 2021 holiday season is officially upon us here in the United States which means it’s time for my annual gift giving guide. I used to panic every year whenever my spouse, parents, and siblings asked me what I wanted for Christmas. I needed to give them an idea otherwise I’d end up with an ugly sweater or some random gadget I would never use.

So to help alleviate some of my stress I started compiling my own holiday gift guide. It’s kind of like the big toy catalog you used to get as a kid, only this is for adults. I’ve made a list of items I think would be very useful or exciting for your fellow Excel users, sorted by different categories (and yes, this post does contain Amazon affiliate links). Some of these items I already use on a daily basis and others are things that are on my own personal wish list. It's my biggest and best gift guide yet! Enjoy!

Sunday, August 29, 2021

How to Search an Outlook Email Folder by using an Excel VBA Macro

One exciting aspect of using macros in Excel is that they can “talk” to other programs, like PowerPoint. One example I’ve shared is exporting data from Excel into Microsoft Word as the basis for writing a book. Another common use is exchanging information with Microsoft Outlook and writing emails from Excel. Previously, I showed how you can send emails from Excel. Today I want to show you a quick example how you can export email data from a folder in Outlook to Excel.

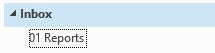
Let’s pretend you’ve saved emails every month with monthly expenses for your business in a folder called “01 Reports” in your Outlook email. You want to summarize the expenses in an Excel sheet without having to open and copy and paste every email in the folder. A macro in Excel written with VBA is the perfect solution for this scenario. Here’s how to do it.


First, setup the template. In cell A2 I am going to allow the user to write in the name of the folder they want to search through for the email reports to export to Excel. Then, we will place the email report date, email sender, and the expense cost into columns B, C, and D respectively. Once the template is setup, we can begin coding.


Create a new macro called “Search_Email_Folder.” Open the Visual Basic Editor (VBE). Go to Tools > references. In the object library, scroll down and Check the box of “MICROSOFT OUTLOOK 14.0 OBJECT LIBRARY” to make it available for Excel VBA.


Add a header to the top of the code that explains what the macro does. This macro loops through a specified folder in Outlook to export all the expense report data

Sub Search_Email_Folder()

On Error GoTo ErrHandler


  'Optimize Macro Speed

    Application.ScreenUpdating = False

    Application.EnableEvents = False

    Application.Calculation = xlCalculationManual


    Dim WS As Worksheet

    Set WS = Worksheets(1)


    'Find the last non-blank cell in column B and clear all the old data

    Dim lRow As Long

    lRow = Cells(Rows.Count, 2).End(xlUp).Row

    WS.Range("B2:G" & lRow).ClearContents


The Outlook object model provides all of the functionality necessary to manipulate data that is stored in Outlook folders, and it provides the ability to control many aspects of the Outlook user interface (UI). What is MAPI? Use GetNameSpace ("MAPI") to return the Outlook NameSpace object from the Application object. The only data source supported is MAPI, which allows access to all Outlook data stored in the user's mail stores. This is a “late binding” example. the following code sets an object variable to the Outlook Application object, which is the highest-level object in the Outlook object model. All Automation code must first define an Outlook Application object to be able to access any other Outlook objects. Most programming solutions interact with the data stored in Outlook. Outlook stores all of its information as items in folders. Folders are contained in one or more stores. After you set an object variable to the Outlook Application object, you will commonly set a NameSpace object to refer to MAPI, as shown in the following example.


        Dim objOutlook As Object

        Set objOutlook = CreateObject("Outlook.Application")

        Dim objNSpace As Object

        Set objNSpace = objOutlook.GetNamespace("MAPI")

        Dim myFolder As Object


        '---define the Outlook folder to search through. refers to cell so anyone can change the text without changing the macro code

        Dim EmailFolderToSearch As String

        EmailFolderToSearch = WS.Cells(2, 1) '—place name of folder in cell A2. must update if insert new columns before the first one


        'error handling if no folder specified

        If EmailFolderToSearch = "" Then

        MsgBox "No folder specificed."

        Exit Sub

        Else

        'proceed

        End If


        'MsgBox EmailFolderToSearch

        ‘the email folder to loop through is actually a sub folder of the Inbox

        Set myFolder = objNSpace.GetDefaultFolder(olFolderInbox).Folders(EmailFolderToSearch)

        Dim rcvDate As Date

        Dim iRows As Integer

        Dim objItem As Object

        Dim EmailSender As String

        Dim SenderEmailAddress As String

        Dim NumofReports As String

        Dim filID As Integer

        Dim DrwPost As Integer

              iRows = 2

             MsgBox "The number of emails found is: " & myFolder.Items.Count & " in " & myFolder.Name & " folder."

              'Loop through every email in outlook drawing folder

        For Each objItem In myFolder.Items

                   If objItem.Class = olMail Then

                Dim objMail As Outlook.MailItem

                Set objMail = objItem


                rcvDate = objMail.ReceivedTime

                EmailSender = objMail.SenderName

                SenderEmailAddress = objMail.SenderEmailAddress


                If Left(SenderEmailAddress, 3) = "/O=" Then

                    'internal gemail, skip, don't increase the row number

                                  Else

                ‘where to put the data in the Excel sheet:

                    WS.Cells(iRows, 2).Value = rcvDate

                    WS.Cells(iRows, 3).Value = EmailSender

                    WS.Cells(iRows, 4).Value = SenderEmailAddress


                     'find the number of reports, information contained within the body of the email

                     filID = 0

                     DrwPost = 0

                mailBody = objMail.Body

 ‘search the email body for the word REPORTS

                filID = InStr(1, mailBody, "REPORTS", vbTextCompare)


                        If filID> 0 Then

                            DrwPost = filID + 6

                            NumofReports = Mid(mailBody, DrwPost, 15)

                            WS.Cells(iRows, 7).Value = NumofReports

                            Else

                            'number of reports not found

                        End If

                                           iRows = iRows + 1

                End If

                       End If

        Next

                  'Release

        Set objMail = Nothing

        Set objOutlook = Nothing

        Set objNSpace = Nothing

        Set myFolder = Nothing

   ErrHandler:

    Debug.Print Err.Description

          'Reset Macro Optimization Settings

        Application.EnableEvents = True

        Application.Calculation = xlCalculationAutomatic

        Application.ScreenUpdating = True

         MsgBox "Macro complete!"

 End Sub

Tuesday, July 27, 2021

Weighted Olympic Medal Count 2021

In honor of the 2020 Summer Olympic Games currently being held in Tokyo, Japan (in the year 2021 no less), I decided to create a Microsoft Excel spreadsheet template for the medal count as I did for the 2018 Winter Olympics, 2016 Summer Olympic Games, 2014 Winter Olympics and 2012 Summer Olympics. There are two primary methods most websites appear to be ranking the 2020 medal count. Most sites rank countries by the total number of Olympic medals won. Other sites, like the International Olympic Committee (or IOC) rank countries by their gold medal count. And others rank by other factors like per capita or GDP.

Pictured below is a bar chart showing all medals won for the top 22 countries (as of the time of this posting on 7-27-21). The bar chart is created in Excel by highlighting the data then going to Insert>Bar>Stacked Bar chart. Change the colors of the bars by right clicking on them then use the drop down menu to select the data you want to change.. You can update the chart yourself by download the Excel file here.


weighted Olympic Medal count 2021 in excel


I’ve devised my own ranking system to give each Olympic medal a weight where the silver is worth half a gold medal and a bronze is worth only a quarter of the gold. Based on this new scoring system, previous Olympic results suddenly became quite interesting. However, for the 2020 Summer Games not too much actually changes (so far, will revisit after more events are completed).


Download the spreadsheet and see for yourself. I’ve shared my Olympic Medal Count spreadsheet and listed out the Olympic medals by country. How would you weight each medal against the others? Comment below and share any of your Olympic medal rating systems!

Thursday, July 15, 2021

2021 NFL Helmet Schedule Spreadsheet – finally automated!

One of the many templates I update and release on an annual basis is my NFL Helmet schedule spreadsheet, where you’ll find the complete schedule for every single pro football team’s season with an image of each team’s helmet. Updating the schedule by hand is very tedious. Thankfully, a reader did it for me last year. But I’ve always wanted to automate a solution. To do this, there were two main problems to solve:

1. How to get the NFL schedule into Excel quickly without a lot of manual work

2. How to assign the correct helmets to every game without doing any manual work

I’ve finally got a solution for both problems and can proudly say the sheet is now fully automated. Here’s how it works.

Getting the NFL Schedule Into Excel


Problem number one: how to get the complete NFL schedule into Excel without having to copy and paste 32 team’s individual schedules manually. There’s got to be an online solution, right? First, I went to NFL.com. No good: no easily copy-able full schedule. Next, tried ESPN. Success! Grid format is perfect for copying pasting right into Excel. As long as ESPN (or another site) always posts the schedule in this format we can update all 544 games and their helmets within a minute. If you download my template, unhide the hidden columns. The blue cells are copy and pasted directly from ESPN. I use formulas to change the three letter team abbreviations into the full team names. 

As you can see, the NFL expanded the regular season this year by one game, from 16 to 17 (plus each team gets a bye week hence 18 weeks in the regular season). The preseason is reduced form 4 to 3 games.


Automating Assigning All the Helmets

Problem number two: how to populate the schedule with all the helmets? I was thinking about using linked pictures like I do in my Super Bowl Squares template. But this would have required adding a formula in name manager to all 544 helmets. Instead, I decided to have a macro copy and paste helmets associated with each team automatically into the schedule. This required giving all 32 helmets a unique variable name, which was time consuming, but now that I have it setup I don’t have to change again, even when it’s time to update for next year’s schedule.

On previous versions of the sheet I divided out the two conferences on separate sheets: NFC and AFC. This year, I’ve put all the teams into one sheet. However, there is a new filter option where you can filter by NFC or AFC or even by division: AFC North, AFC South, etc.

2021-2022 nfl schedule in excel spreadsheet


Download the 2021 NFL Helmet Schedule Spreadsheet


Watch the video below to see how the filter works. I also so a tip in Excel how to select multiple objects at once with the mouse. And I walk through the populate helmets macro code as well. Lots of good stuff here!


Please note, an email is required to download it. I do this so you will be automatically updated you if changes or additions are made and will update you when the next year’s schedule is ready. I do not use your email for anything else.

This goes to show you a little bit of time and thinking now can save you a LOT of time and trouble later on.

As you can see, the NFL helmet schedule is printable too. You can save the spreadsheet as a PDF file or print it out and pin it up in your cubicle at work. If you do, please email or tweet me a picture of it hanging up - I'd love to see it!

As always, I welcome any comments or suggestions about how to fix or improve the sheet! How can I improve this football spreadsheet into something you’ll use all the time during pro-football season? What future features would you like to see?


Wednesday, June 30, 2021

Podcast Analytics Tracking Spreadsheet

When the COVID-19 pandemic struck last year, many people were stuck at home with nothing to do so they started podcasting. As many of you may know, I love traveling to theme parks around the country. We had discussed starting a podcast for a site I also created content for, Coaster101.com, for years but it wasn’t until the midst of the global pandemic when we finally turned it into reality. Listen to me ramble about visiting amusement parks and riding roller coasters here: https://www.coaster101.com/podcast/

Once we got the hang of recording and it become a permanent thing, we started to analyze our analytics to try to decide what was working and what wasn’t. By understanding the data, you can make decision to help you grow your podcast. Like everything else I do, I decided to make a spreadsheet to track specific stats I had in mind. I’ve turned it into a template you can use, available to download for free here.

podcast tracking spreadsheet


 As I always say, even if you don't have a direct use for this spreadsheet you can still learn something about Excel by examining this template.

For starters, it uses Ranking formulas in Excel to show the most popular and least popular episodes. As I do with almost all of my spreadsheets, I color code the columns so I can easily know which require manual data input by me, which are drop down lists, and which use formulas to be left alone. I use the TODAY() formula to help determine how many days old a podcast episode is (because one just released will obviously have fewer downloads than other episodes). You’ll see there are SUMIF and VLOOKUP formulas as well. Feel free to take a look:

Podcast Downloads Tracking Spreadsheet here

Monday, June 21, 2021

How to Add Conditional Formatting with a Macro

Conditional Formatting is a useful tool in Excel that allows you to do things like highlight duplicate cells, or color every other row in with color, and so on. If you have a large range or table with many conditional formatting rules, sometimes things can get a little messy. If you’re inserting, adding, or deleting rows and columns often, your conditional formatting rules might go from a short, highly understandable list, to a complete cluster:


One way to be able to reset your conditional formatting rules is with a macro. We’re going to use a macro to automatically delete the conditional formatting and then add it back.

First, to clear and delete all the conditional formatting from a sheet with a macro, use this code, changing the A:AQ with whatever range you’re using:

    '--------delete the conditional formatting--------

With ActiveSheet.Range("A:AQ")

    .FormatConditions.Delete

End With

Now it’s time to add conditional formatting with a macro. In this example, I have a status column C where I enter values, and based on these values the format of my range will change.

Use LastRow to find the last row of data, making it a dynamic range (meaning the size of the range changes based on how much data is inside the range).

'define the last row

LastRow = Cells(Rows.Count, 1).End(xlUp).Row

First, define the range where you want to apply the formatting.

Next, define the formula or rule. Here, I want if the value in Column C is the letter N to change the font color to red. I use double quotations to have a quotation. Notice there is only one $ sign. If I put $C$11 then the formula would not trickle down through the rest of the range.

Finally, define the condition, font color to red the color index is 3. See the font color index here: https://www.automateexcel.com/excel-formatting/color-reference-for-color-index/

This is the first rule I am adding so notice the (1) inside the parenthesis.

'-------add the conditional formatting-------

'if new, change font to red

  With ActiveSheet.Range("D11:AP" & LastRow)

     .FormatConditions.Add Type:=xlExpression, Formula1:="=$C11=""N"""

     .FormatConditions(1).Font.ColorIndex = 3

End With


Now I want to add another conditional formatting rule programmatically. This time, change the font color to green if there is an H in the column C. Green uses a 4 in the color index. This is the 2nd rule so notice the (2).


'if h, change font to green

  With ActiveSheet.Range("D11:AP" & LastRow)

     .FormatConditions.Add Type:=xlExpression, Formula1:="=$C11=""h"""

     .FormatConditions(2).Font.ColorIndex = 4

End With


Finally, if there is an X in column C, I want to use strikethrough to cross out the words.


'if x, then cross-out

   With ActiveSheet.Range("D11:AP" & LastRow)

     .FormatConditions.Add Type:=xlExpression, Formula1:="=$C11=""x"""

     .FormatConditions(3).Font.Strikethrough = True

End With

 Here's what the conditional formatting rules look like after running the macro:

And that’s how you add conditional formatting with a macro. Let me know in the comments below if you have any questions.

Wednesday, June 16, 2021

How to Make a Drop Down List From a Macro

Drop down lists in Excel are super helpful when you want to limit a user’s input to a set of predetermined choices. Normally, drop down lists can be made by clicking on a cell, going to the data tab, then by using the Data Validation function. Change Allow to List. 

But what if you’re importing data from another Excel file and want to automatically create a drop down list? It’s possible to do using VBA. To create a drop down list from a macro in cell A1, try this code in the VBA editor:


Sub ListCreator()

Range("A1").Validation.Add Type:=xlValidateList, AlertStyle:=xlValidAlertStop, _ Formula1:="OK,Maybe,No"

End Sub


Here, all the entries in the list will be created from the macro. What if one of the entries needs to change? Only someone with VBA experience will probably be able to figure out how to change it. So I like to create the list somewhere within the spreadsheet where anyone can see it and it’s obvious what it’s used for, then use the Name Manager to create a Named Range to easily refer to the list. This way, if you decide to add entries later the lists will automatically be updated as long as they used the Named Range.


In this example, I select my list within the Excel sheet (column G), and give it the name “Status”.

To used a Named Range when you create a drop down list via VBA, simply refer to the Named Range:


Range("A2").Validation.Add Type:=xlValidateList, AlertStyle:=xlValidAlertStop, Formula1:="=Status"


To set a default value, simply set the value of the cell after changing the data validation:


Range("A2").Validation.Add Type:=xlValidateList, AlertStyle:=xlValidAlertStop, Formula1:="=Status"


Range("A2").Value = “OK”


It might be easier to understand by watching this short video:


That’s all there is to it! Now you know how to add a drop down list from a macro in Excel. How often do you use drop down lists? I’d love to know, so let me know in the comments below.

Monday, March 15, 2021

Excel Tips from the Best 2021 March Madness Brackets

After a year hiatus it’s finally here, the college basketball March Madness brackets are back! Last year, I made a NFL Draft Game spreadsheet for the first time to try to compensate for the loss of the basketball brackets but it just wasn’t the same (but I did still update it for 2021). This year, the 2021 NCAA men's basketball tournament will be unlike any March Madness that has come before. All games will be played in Indiana, with most in Indianapolis. The schedule has also been change. The First Four would typically be played on Tuesday and Wednesday night with the first round being played on Thursday and Friday. 

Here's the 2021 March Madness schedule:

  • First Four — 4 p.m. start on Thursday, March 18
  • First round — 12 p.m. start on Friday, March 19, and Saturday, March 20
  • Second round — 12 p.m. start on Sunday, March 21, and Monday, March 22
  • Sweet 16 — 2 p.m. start on Saturday, March 27, and 1 p.m. start on Sunday, March 28
  • Elite Eight — 7 p.m. start on Monday, March 29, and 6 p.m. start on Tuesday, March 30
  • Final Four — 5 p.m. start on Saturday, April 3
  • NCAA championship game — 9 p.m. Monday, April 5

Once again, I will be using the best March Madness brackets in Excel, created by David Tyler (and I will continue to use his until he decides to no longer update them). They’re very polished and easy to use. There are only 68 teams in the field but the spreadsheet is already setup to handle up to 128 teams, if they expand in the future. There are two sheets: the bracket and the pool manager. Instructions are included but its very intuitive. 

march madness 2021 bracket spreadsheet template


The First 5 Things I Do When Examining Someone Else's Spreadsheet

As I’ve said countless times before, you can learn a lot by looking at templates made by others. Here are 5 things I do when examining a new spreadsheet:

1. Unhide hidden sheets, columns, and rows: When you make a template others are going to be using, you want to make it look nice and clean and hide anything that could cause confusion to a first time user, which leads to hiding rows, columns, or even entire sheets in a workbook. So, the first thing I do when examining someone else’s template is look for the hidden data. Right click on the sheets tab and click “unhide”. I unhide all the hidden sheets if there are any to see what data is present. Look for any hidden columns or rows as well by seeing if any letters or numbers are skipped.


2. Understand the NamedRanges: Go To Formulas > Name Manager and examine what the named ranges are, what sheets and cells they refer to. Hopefully they're all named well, like in David's brackets.


3. Look at conditional formatting rules: On the Home tab, go to Conditional Formatting, click Manage Rules, then Show formatting rules for This Worksheet to view them all.


4. Look through the formulas: On the Formulas tab, click “show Formulas” to show if they were manually typed in or if there is a formula calculating the values


5. Look through the macros: Hopefully, the person writing the code left lots of good comments so it’s easier to follow along with what each piece of code does


Watch me quickly walk through David's 2021 March Madness brackets going through the five points listed above:


Tuesday, March 9, 2021

2021 NFL Draft Game Spreadsheet Template

It’s been one year since the COVID-19 pandemic began. Last year, since March Madness and other sports at the time were cancelled, I started thinking about what other things I could do to fill in the void of not having any March Madness brackets to fill out. The answer came in a suggestion from a reader to create an NFL Draft game spreadsheet. I’ve updated the template for this year.


Inside this template I've listed the top 100 draft prospects according to ESPN. Each draft game player (and the template is currently setup to handle ten players) are randomly assigned ten future NFL players by using a randomize macro. The earlier your players get drafter the better, as the draft position counts for points and the lowest number of points wins!

The random number macro is pretty simple:

'define range of cells for random numbers

Dim Player1 As Range

Set Player1 = Range("AN2:AN101")

Player1.ClearContents

For Each a In Player1

Do

a.Value = (Int((100 * Rnd + 1)))

Loop Until WorksheetFunction.CountIf(Player1, a.Value) < 2

Next


Based on some good user feedback I added the option where each player can now try to predict which team will select their players for additional bonus points. Well, negative bonus points that is, as it subtracts points from your total score (remember, lowest score wins).

See how the Draft Game spreadsheet works in the video below:

Even if you have no interest in the NFL, football, or drafts, you can still learn a bit about Excel by examining the random number generator macro, or the vlookup and sumif formulas used. The scoreboard uses a “rank without ties” formula:

 =(IF(D3<>"",(RANK(D3,$D$3:$D$52)+COUNTIF(D$3:D3,D3)-1),""))

For now, the spreadsheet is setup to handle ten players. To add more, the formulas and macro will need to be modified. If enough people are interested in using this sheet, I will work on making it scalable so it can automatically adjust to the exact number of players.

2021 NFL Draft Game Spreadsheet Template.xlsm 

Let me know if you like this game or if you have any suggestions or questions.


Thursday, February 4, 2021

COVID-19 Vaccine Distribution Tracking Template

Not sure if this is helpful to anyone but I made a COVID-19 Vaccine Distribution Tracking document in Excel. It’s hard to make a spreadsheet that you’re probably not going to use personally yourself. But I tried to envision being in management of a company or nursing home or school that needed to:

 (1) prioritize which employees or residents or teachers should get the vaccine first and

 (2) track which people have actually gotten the vaccine and when.


covid-19 vaccination tracking spreadsheet

What Order to Distribute the Vaccine

The first item I tackled was how do you decide in what order to give out the vaccine. Knowing that supplies are limited, who gets the first dose?

I use a scoring system to decide the priority order: the highest score is first in line to get their shots.

 Here’s how the score is calculated:

  1. Age: the score starts with the person’s age. 30 years old = 30 points. The older population automatically has a higher score.
  2. Age multiplier: I made up a tier system based on age. Based on earlier data I’ve seen, the chance of dying from COVID if you’re 59 years or younger is only around 1% or less, but this jumps up to nearly 20% if you’re 80 or older. In my scoring system, those 60 and older get varying amounts of “bonus” points added to their score depending on what age range tier they fall into.
  3. Priority person: Yeah, you could just rank vaccination order by age and be done with it but I didn’t want age to be the only limiting factor. There are other variables that I wanted to account for. I added the ability for a person to be marked as “high priority”, maybe due to immune deficiency or because they’re a first responder, or pregnant – whatever you want it to be. This adds 11 points to their score to help bump them up in the distribution order. Again, the spreadsheet is easily customizable so you can change the bonus to whatever value fits your needs.
  4. Male or female: This might be controversial, but I added a segment to the scoring where males get a slight score increase over females. From the data I have (and please send me any new information if you think I’m wrong) males have a ~3% higher death rate from COVID than females (women are generally better at fighting off infections I’ve heard) so they get +3 point bonus while females get none. Of course, feel free to change this setting to make it what you want. Give woman 1,000 bonus points and men 0 – it’s up to you and can be easily changed in the spreadsheet.

The total score is calculated by adding up the age, the age tier multiplier, the male/female bonus, and the priority bump. The biggest factor is age, as that is the biggest factor of death rate. While getting the highest score means you’re first in line to get the vaccine, that also means you have the highest risk of dying from COVID.  I then use the RANK function in Excel to rank the individuals from highest to lowest score. There’s your priority list of who gets the vaccine first.


Vaccine Distribution Tracking

The next component, after deciding the vaccination order, is to then track if these people actually got the vaccine. Complicating matters, there are (right now) two different vaccines being distributed in the US requiring two separate doses and the time between doses is different. Each vaccine also has a minimum age requirement that is different so there is a formula to make sure the individual is old enough to get the selected vaccine. If they’re not eligible, meaning you’re too young, your score automatically goes to 0 and I use condition formatting to turn the cells black to show the individual shouldn’t be scheduled to get a shot. Once you get the first dose, enter the date and the spreadsheet will tell you when the earliest is you can get the second dose based on which vaccine you got. Finally, you can quickly see how many of your employees or residents have received the first or second doses of the vaccine.

 Download the spreadsheet here: https://gumroad.com/l/covid-tracker

I’ve been wanting to put my Excel powers to good use rather than just making Super Bowl squares or football related spreadsheets. Not sure the legality of it but if I was in charge of a company with employees working from home I would want to know when it is safe to bring that back into the office. Try it out and let me know what you think!

Friday, January 8, 2021

2021 Super Bowl Squares Spreadsheet – the only template you’ll ever need

I’ve been creating Super Bowl Squares spreadsheets for ten years now. Every January I’d update the template and add more sheets with more ways to play. It’s gotten to the point where it’s a bit of a mess when opening the workbook and seeing all these different colored tabs with similar yet different names. It was getting annoying dealing with multiple game boards, multiple score managers, etc. and probably very confusing to new users. 

The old version of the Super Bowl Squares template

I’ve had an idea for streamlining and improving the grid game spreadsheet for over two years but just finally had enough time and energy to work on it before the actual Super Bowl. It’s taken many hours of work setting up the macros and testing all of the conditions but it’s finally ready: the new and improved Super Bowl Squares template is here!

super bowl pool download


When you first open the template you’ll notice the big changes right off the bat. You’re met with a simple setup screen where the user will decide how to play the game. The sheet automatically updates the Super Bowl boxes and the leaderboard to reflect only the version of the game you want to play. 

printable super bowl squares in excel


I used to have to update the sheet every year by inputting the teams and their helmets. This time, all the teams and helmets are in one of the sheets. Simply use the drop down lists in the Squares sheet to select the team from the list (broken up by AFC and NFC) and their helmets will update automatically! 

Watch me demo the new Super Bowl board in the video below:


As you can see, the new sheet allows more ways to play but is simple and easy to setup and is automated as much as possible. 


Even if you’re not into football, you can still use the template to learn how to do these Excel tricks:
  • Lookup pictures based on cell values
  • Generate random numbers
  • Use NameManager
  • Create drop down lists
  • Use index and match formulas
If you dissect the macros in the spreadsheet you’ll learn how to:
  • Hide rows and columns
  • Hide or unhide sheets
  • Generate random numbers between 0 and 9 with no duplicates
  • How to hide command buttons by VBA
  • How to change cell fill color
Update 1-19-2021

I've updated the spreadsheet again. There are now 54 ways to play within one slick spreadsheet. I added options to play by quarters, every minute, or every time the score changes. Watch me preview the update below. Also be sure to subscribe to my email list and YouTube channel as I'll be showing off all the tricks and tips I used to make this spreadsheet work.

*Intended for PC/Microsoft Office/Excel. I don't think it will work in Mac Numbers*


Get it here (enter a 0 into the price box then input an email address):


Let me know what you think. I’d love to hear from you. Is this version as much of an upgrade and easy to use as I think it is? I welcome any and all questions, comments, suggestions, cuss words, and compliments. Let me know using the comments below or via email. Enjoy playing Super Bowl Squares!