Showing posts with label Olympics. Show all posts

Monday, August 5, 2024

Weighted Olympic Medal Count 2024

In honor of the 2024 Summer Olympic Games currently being held Paris, France, I've updated my Microsoft Excel spreadsheet template for the medal count as I did for the 2022 Winter Games, 2020 (2021) Summer Olympic Games, 2018 Winter Olympics, 2016 Summer Olympic Games, 2014 Winter Olympics and 2012 Summer Olympics. 

There are two primary methods most websites appear to be ranking the 2024 medal count. Most sites rank countries by the total number of Olympic medals won. Other sites, like the International Olympic Committee (or IOC) rank countries by their gold medal count. And others rank by other factors like per capita or GDP.

Pictured below is a bar chart showing all medals won for the top countries (as of the time of this posting on 2-14-22). The bar chart is created in Excel by highlighting the data then going to Insert>Bar>Stacked Bar chart. Change the colors of the bars by right clicking on them then use the drop down menu to select the data you want to change.


See the latest official medal count here.


I’ve devised my own ranking system to give each Olympic medal a weight where the silver is worth half a gold medal and a bronze is worth only a quarter of the gold. Based on this new scoring system, previous Olympic results suddenly became quite interesting. However, for the 2024 Summer Games not too much actually changes (so far, will revisit after more events are completed). The first five countries ranking is unchanged. It gets really interesting in the 25-35 range.


Download the 2024 Olympic Games medal count spreadsheet and see for yourself. 

I’ve shared my Olympic Medal Count spreadsheet and listed out the Olympic medals by country. How would you weight each medal against the others? Comment below and share any of your Olympic medal rating systems!

Sunday, January 22, 2023

Elevate Your Sports Betting Game with Our Free Excel Tracking Tool

Sports gambling just became legal here in Ohio and we've been flooded with sign-up offers. Since just about every sportsbook will give you free bonus bets (around $200) for a small ($5 or $10) deposit, I decided to dabble a little bit into sports betting to see what all the fuss is about. I signed up for three different sportsbook sites and quickly realized I needed a way to organize and track all my bets.


Naturally, I decided to make an Excel template to track which bets I'd made, track my earnings, and make sure I was still making a profit. First, I created a Lists sheet for all my drop down lists including which sportsbook, which sport, result, and so on. Personally, so far I've only stuck to football because that's what I follow the most and already have some interest and knowledge in it.


The Bet Tracker sheet is used to track every individual bet including the odds, wager amount, and formulas to determine the potential winnings and the actual result.

bet tracker sheet

When you bet with your own money, if you win the bet you get the winnings plus your original bet back. But when you use Bonus money to place your bet, that "fake" money is not added to the winnings. I had to account for this in my Potential Winnings column formula.

If your own money then: Winnings = ((Odds/100)*Wager)+Original Wager

If bonus money then: Winnings = (Odds/100)*Wager)

=IF(E2="My$",((G2/100)*F2)+F2,((G2/100)*F2))

If you get lucky and win a bet, you'll be able to withdraw the money into your own bank or Paypal account. There's a summary sheet to track exactly how much money you've put in versus what has come out. The most important stat to me is my running total, and making sure it is well in the positive otherwise it's time to quit. 


How have I done? In the past two weeks, I placed 33 bets and won 8 of them. I've only had to input $27 of my own dollars, while I've gotten to bet $650 bonus bucks. I'm not huge into taking risks, so instead of betting on crazy parleys with larger payouts, I've bet on safer, more likely outcomes but with smaller rewards. What do I plan to do with my winnings? Probably invest in an AI company since they're changing the game.

In all my years of making sports related Excel spreadsheet templates, I've never really gambled on sports. I'm not sure I'll keep gambling once my free funds run out, but it is a fun experiment while it lasts. Like playing fantasy football or Super Bowl Squares, it gives you an extra incentive for watching the game. Hey, speaking of Super Bowl Squares, I've got a new version coming out this weekend and I can't wait to hear your thoughts on it...

.Download Sports Bet Tracker.xlsx file here

Monday, February 14, 2022

Weighted Olympic Medal Count 2022

In honor of the 2022 Winter Olympic Games currently being held  Beijing, China, I decided to create a Microsoft Excel spreadsheet template for the medal count as I did for the 2020 (2021) Summer Olympic Games, 2018 Winter Olympics, 2016 Summer Olympic Games, 2014 Winter Olympics and 2012 Summer Olympics. 

There are two primary methods most websites appear to be ranking the 2022 medal count. Most sites rank countries by the total number of Olympic medals won. Other sites, like the International Olympic Committee (or IOC) rank countries by their gold medal count. And others rank by other factors like per capita or GDP.

Pictured below is a bar chart showing all medals won for the top countries (as of the time of this posting on 2-14-22). The bar chart is created in Excel by highlighting the data then going to Insert>Bar>Stacked Bar chart. Change the colors of the bars by right clicking on them then use the drop down menu to select the data you want to change.


You can update the chart yourself by download the Excel file here.


As of 2/14/22


I’ve devised my own ranking system to give each Olympic medal a weight where the silver is worth half a gold medal and a bronze is worth only a quarter of the gold. Based on this new scoring system, previous Olympic results suddenly became quite interesting. However, for the 2020 Summer Games not too much actually changes (so far, will revisit after more events are completed).


If you’ve been reading my blog for awhile, you’ll probably know I’m a roller coaster enthusiast, so you probably won’t be surprised that the Olympic event that intrigues me the most is the bobsled and luge. As they said on the broadcast of the monobob following the Super Bowl, “this track more than any other is similar to a roller coaster” as it has 4 uphill sections and a helix. It’s over 4,000 feet long, has a total elevation difference of 117 meters (383 feet), and bobsleders were hitting 75 miles per hour while sustaining 4gs up to 7 seconds at a time. That’s intense! A ride on a bobsled would scare me more than any roller coaster that’s secured to the rails, as you could legit crash! What Winter Olympic sport do you like to follow?


Download the spreadsheet and see for yourself. 

I’ve shared my Olympic Medal Count spreadsheet and listed out the Olympic medals by country. How would you weight each medal against the others? Comment below and share any of your Olympic medal rating systems!

Tuesday, July 27, 2021

Weighted Olympic Medal Count 2021

In honor of the 2020 Summer Olympic Games currently being held in Tokyo, Japan (in the year 2021 no less), I decided to create a Microsoft Excel spreadsheet template for the medal count as I did for the 2018 Winter Olympics, 2016 Summer Olympic Games, 2014 Winter Olympics and 2012 Summer Olympics. There are two primary methods most websites appear to be ranking the 2020 medal count. Most sites rank countries by the total number of Olympic medals won. Other sites, like the International Olympic Committee (or IOC) rank countries by their gold medal count. And others rank by other factors like per capita or GDP.

Pictured below is a bar chart showing all medals won for the top 22 countries (as of the time of this posting on 7-27-21). The bar chart is created in Excel by highlighting the data then going to Insert>Bar>Stacked Bar chart. Change the colors of the bars by right clicking on them then use the drop down menu to select the data you want to change.. You can update the chart yourself by download the Excel file here.


weighted Olympic Medal count 2021 in excel


I’ve devised my own ranking system to give each Olympic medal a weight where the silver is worth half a gold medal and a bronze is worth only a quarter of the gold. Based on this new scoring system, previous Olympic results suddenly became quite interesting. However, for the 2020 Summer Games not too much actually changes (so far, will revisit after more events are completed).


Download the spreadsheet and see for yourself. I’ve shared my Olympic Medal Count spreadsheet and listed out the Olympic medals by country. How would you weight each medal against the others? Comment below and share any of your Olympic medal rating systems!

Thursday, February 22, 2018

Weighted Olympic Medal Count 2018

In honor of the 2018 Winter Olympic Games currently being held in PyeongChang, South Korea I decided to create a Microsoft Excel spreadsheet template for the medal count as I did for the 2016 Summer Olympic Games, 2014 Winter Olympics and 2012 Summer Olympics. There are two primary methods most websites appear to be ranking the 2018 medal count. Most sites rank countries by the total number of Olympic medals won. Other sites, like the International Olympic Committee (or IOC) rank countries by their gold medal count. And others rank by other factors like per capita or GDP.

Pictured below is a bar chart showing all medals won for the top 22 countries (as of the time of this posting on 2-22-18). The bar chart is created in Excel by highlighting the data then going to Insert>Bar>Stacked Bar chart. Change the colors of the bars by right clicking on them then use the drop down menu to select the data you want to change. Norway is currently in first place followed by Germany and Canada. You can update the chart yourself by download the Excel file here.

winter olympics medal count excel

Weighted Olympic Medal Count 2018


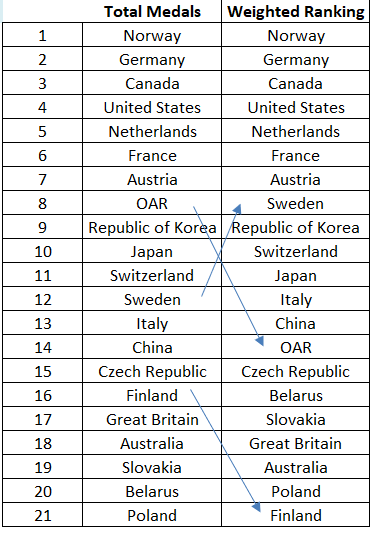
I’ve devised my own ranking system to give each Olympic medal a weight where the silver is worth half a gold medal and a bronze is worth only a quarter of the gold. Based on this new scoring system, previous Olympic results suddenly became quite interesting. However, for the 2018 Winter Games not too much actually changes.

Looking at the new Olympic medal ranking systems yields some interesting results. The top seven countries actually remain in the same order. Biggest change is OAR dropping six places, followed by Finland dropping five places. Sweden benefits the most, gaining four spots.


Download the spreadsheet and see for yourself. I’ve shared my Olympic Medal Count spreadsheet and listed out the Olympic medals by country. How would you weight each medal against the others? Comment below and share any of your Olympic medal rating systems!